#apache自带的ab(http)与abs(https)压测工具用法详解
ab全称为:apache bench ab是Apache超文本传输协议(HTTP)的性能测试工具。其设计意图是描绘当前所安装的Apache的执行性能,主要是显示你安装的Apache每秒可以处理多少个请求。
#在学习ab工具之前,我们需了解几个关于压力测试的概念
- 吞吐率(Requests per second)
概念:服务器并发处理能力的量化描述,单位是reqs/s,指的是某个并发用户数下单位时间内处理的请求数。某个并发用户数下单位时间内能处理的最大请求数,称之为最大吞吐率。
计算公式:总请求数 / 处理完成这些请求数所花费的时间,即
Request per second = Complete requests / Time taken for tests
- 并发连接数(The number of concurrent connections)
概念:某个时刻服务器所接受的请求数目,简单的讲,就是一个会话。
- 并发用户数(The number of concurrent users,Concurrency Level)
概念:要注意区分这个概念和并发连接数之间的区别,一个用户可能同时会产生多个会话,也即连接数。
- 用户平均请求等待时间(Time per request)
计算公式:处理完成所有请求数所花费的时间/ (总请求数 / 并发用户数),即
Time per request = Time taken for tests /( Complete requests / Concurrency Level)
- 服务器平均请求等待时间(Time per request: across all concurrent requests)
计算公式:处理完成所有请求数所花费的时间 / 总请求数,即
Time taken for / testsComplete requests
可以看到,它是吞吐率的倒数。
同时,它也=用户平均请求等待时间/并发用户数,即
Time per request / Concurrency Level
进入apache官网 http://httpd.apache.org/ 下载apache即可
windows可以使用cmd命令 进入 Apache\bin的安装目录 就可以愉快的使用ab.exe 如下图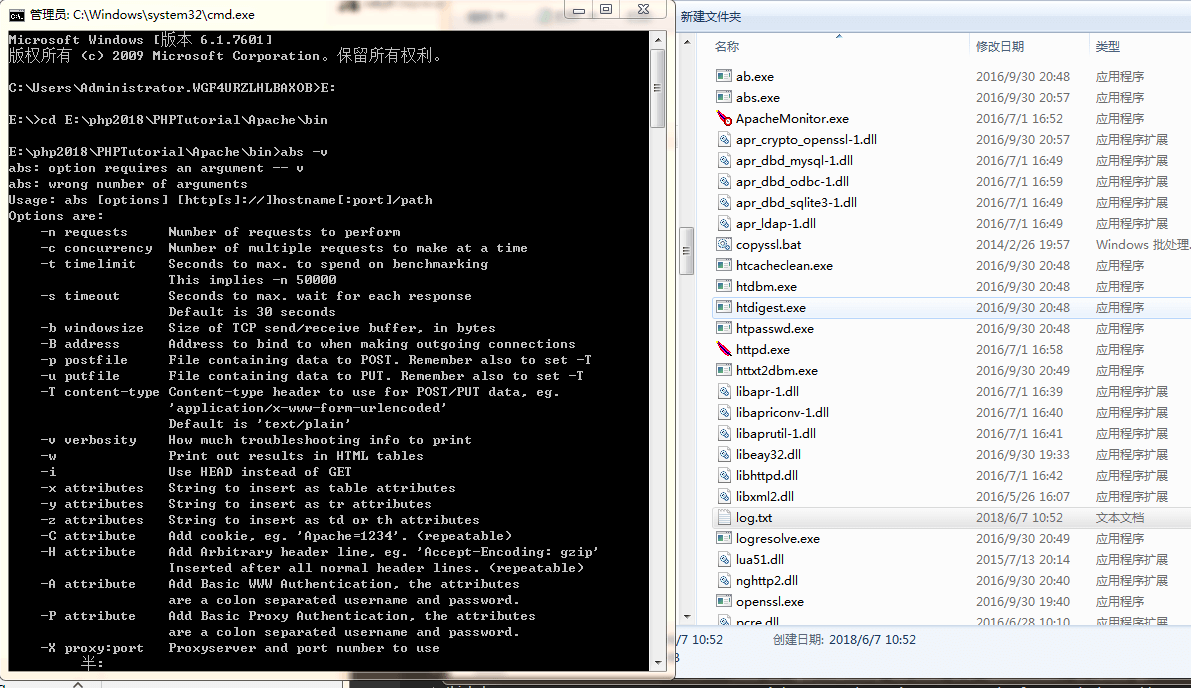
我们先来一段测试代码
ab -c1000 -n1000 https://www.chenxutan.com/
上面命令表示模拟1000个并发用户,发送1000个请求到https://www.chenxutan.com/ 其中-n表示请求数,-c表示并发数
This is ApacheBench, Version 2.3 <$Revision: 1748469 $>
Copyright 1996 Adam Twiss, Zeus Technology Ltd, http://www.zeustech.net/
Licensed to The Apache Software Foundation, http://www.apache.org/
#apache的版本信息
Benchmarking www.chenxutan.com (be patient)


Server Software:        Tengine #apache版本
Server Hostname:        www.chenxutan.com #请求主机
Server Port:            80 #请求端口

Document Path:          / #请求页面
Document Length:        278 bytes #请求页面长度

Concurrency Level:      1000 #并发数据
Time taken for tests:   18.684 seconds #共使用了多少时间
Complete requests:      1000 #请求数
Failed requests:        0  #失败请求
Non-2xx responses:      1000 #统计项,用于统计这部分请求数,这些请求并不算在失败的请求中。
Total transferred:      469000 bytes #总共传输字节数,包含http的头信息等
HTML transferred:       278000 bytes ##html字节数,实际的页面传递字节数
Requests per second:    53.52 [#/sec] (mean)  ##每秒多少请求,这个是非常重要的参数数值,服务器的吞吐量
Time per request:       18684.000 [ms] (mean) #用户平均请求等待时间
Time per request:       18.684 [ms] (mean, across all concurrent requests) #服务器平均处理时间,也就是服务器吞吐量的倒数
Transfer rate:          24.51 [Kbytes/sec] received #每秒获取的数据长度

Connection Times (ms) #链接次数
              最小 平均 (方差)  中位数   最大
              min  mean[+/-sd] median   max
Connect:       16   18   0.9     18      33  #socket链路建立消耗,代表网络状况好坏
Processing:    36 9338 5378.0   9348   18643 #写入缓冲区消耗+链路消耗+服务端消耗
Waiting:       28 9320 5383.0   9329   18634 #写入缓冲区消耗+链路消耗+服务端消耗+读取数据消耗
Total:         54 9356 5378.0   9366   18660 #单个事务总时间

Percentage of the requests served within a certain time (ms)
  50%   9366 # 50%的请求在9366ms内返回
  66%  12337 # 60%的请求在12339ms内返回
  75%  14008
  80%  14941
  90%  16827
  95%  17749
  98%  18311
  99%  18495
 100%  18660 (longest request) #最大响应时间小于18660ms
下面在来一次windows和liunx测试的对比,左边是windows右边是liunx windwos带宽20m liunx 带宽50M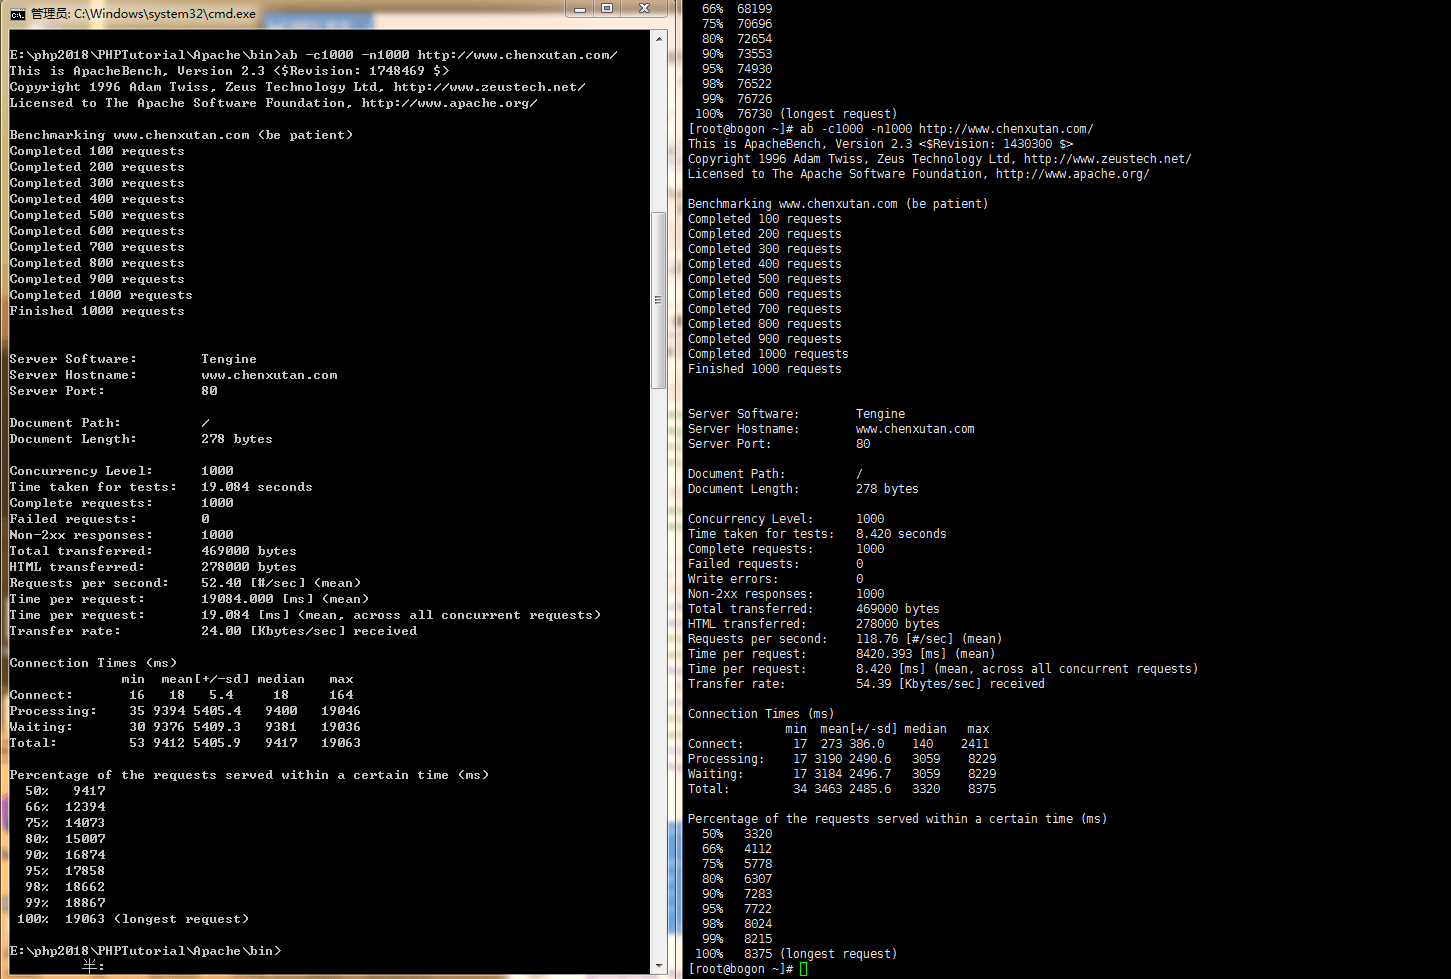
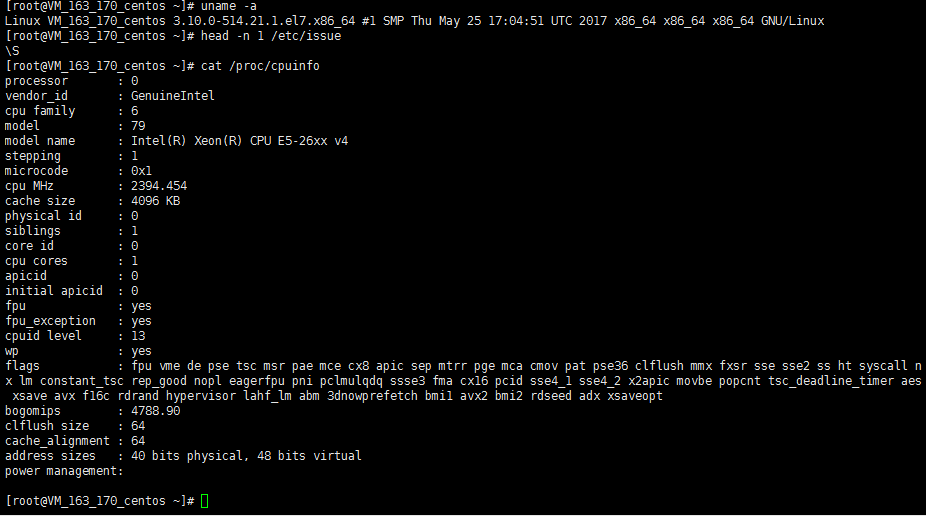
服务器配置如下
[root@VM_163_170_centos ~]# nginx -V
Tengine version: Tengine/2.2.2 (nginx/1.8.1)
built by gcc 4.8.5 20150623 (Red Hat 4.8.5-16) (GCC)
TLS SNI support enabled